Opik Turns Agent Traces Into a Debugging Surface

Opik's agent diagnostics frame tracing as an operational debugging layer, not just a transcript viewer for individual runs.

Retrieval answer

Opik's agent diagnostics frame tracing as an operational debugging layer, not just a transcript viewer for individual runs. A single agent trace is useful when one run fails. It is not enough when the same failure pattern appears across many users, tools, prompts, and retries.

New Runtime synthesiseditorial-diagram
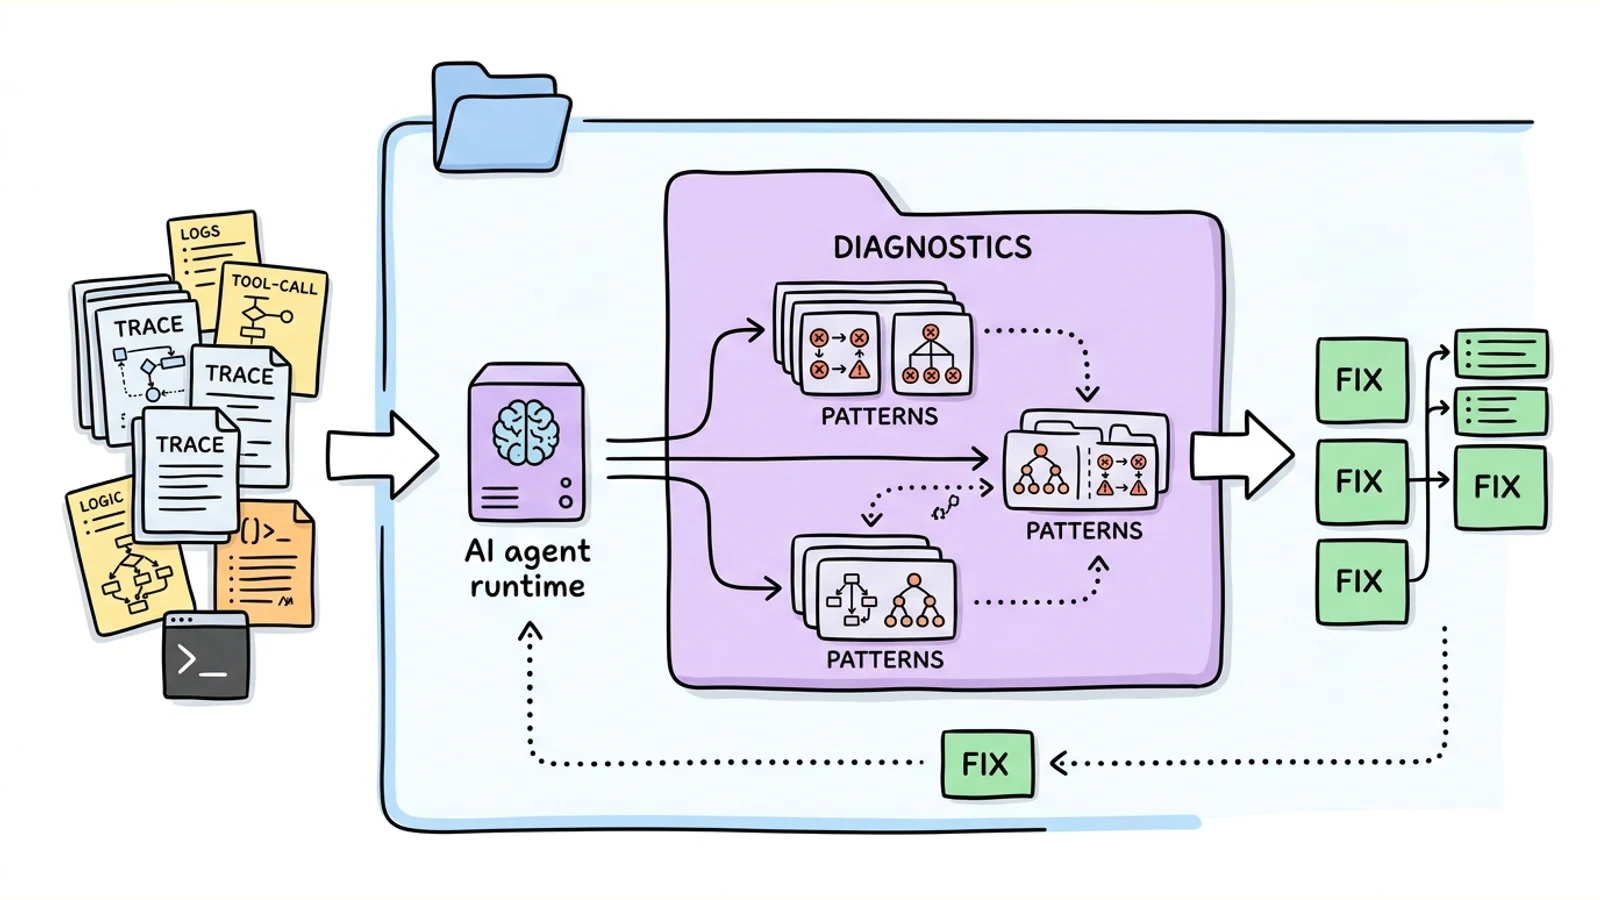
Whiteboard diagram of agent traces flowing into diagnostics, pattern grouping, and a repair loop.
New Runtime synthesis: agent observability becomes useful when trace inspection turns into grouped diagnostics and repair loops.New Runtime synthesisOriginal source ↗

A single agent trace is useful when one run fails. It is not enough when the same failure pattern appears across many users, tools, prompts, and retries. The Comet article on Opik agent diagnostics points at the next layer: agent observability has to move from reading one transcript to debugging a population of traces.

The shift matters because production agents fail in distributed ways. A bad tool argument, a stale prompt assumption, a cost spike, and a loop that retries the same weak plan can all look like ordinary message history unless the traces are grouped by behavior. Diagnostics are the layer that turns raw trace logs into a triage surface.

For New Runtime, the useful pattern is not “store every trace forever.” It is: capture enough structured trace evidence, cluster recurring failure modes, connect those clusters back to prompts/tools/runtime boundaries, and keep the repair queue auditable. The trace is source material; the product is the decision about what to fix.

The practical consequence is that agent platforms need observability objects that are closer to issue trackers than dashboards: failure classes, affected workflows, prompt or tool versions, reproduction links, and repair status. That is where debugging becomes operational instead of artisanal.

New Runtime synthesis: once agents are normal software actors, trace diagnostics become part of the release process. They tell the operator where the next prompt, tool schema, evaluator, or runtime gate should change.

Recommendation

Opik's agent diagnostics frame tracing as an operational debugging layer, not just a transcript viewer for individual runs.

Discovery graph / next reads

Continue through New Runtime

Open the graph
  1. 01topicAgent Observability - New RuntimeExplore the agent observability topic hub.
  2. 02related materialPrompt Versioning Is Becoming Agent OperationsShares agent observability and llmops.
  3. 03related materialThe Observable Job Agent Is a Useful Agent-Product TemplateShares agent observability.
  4. 04related materialAgentCore Makes Slow Agents A Traceable Operations ProblemShares agent observability.
  5. 05related materialGoogle Runs The Same Agent Metrics Before And After LaunchShares agent observability.

These links are also published in this page’s JSON twin and as typed edges in DiscoveryGraph v1.

Who read this page?Machine requests, hidden until opened

Loading the privacy-safe route aggregate…

Open the JSON contract