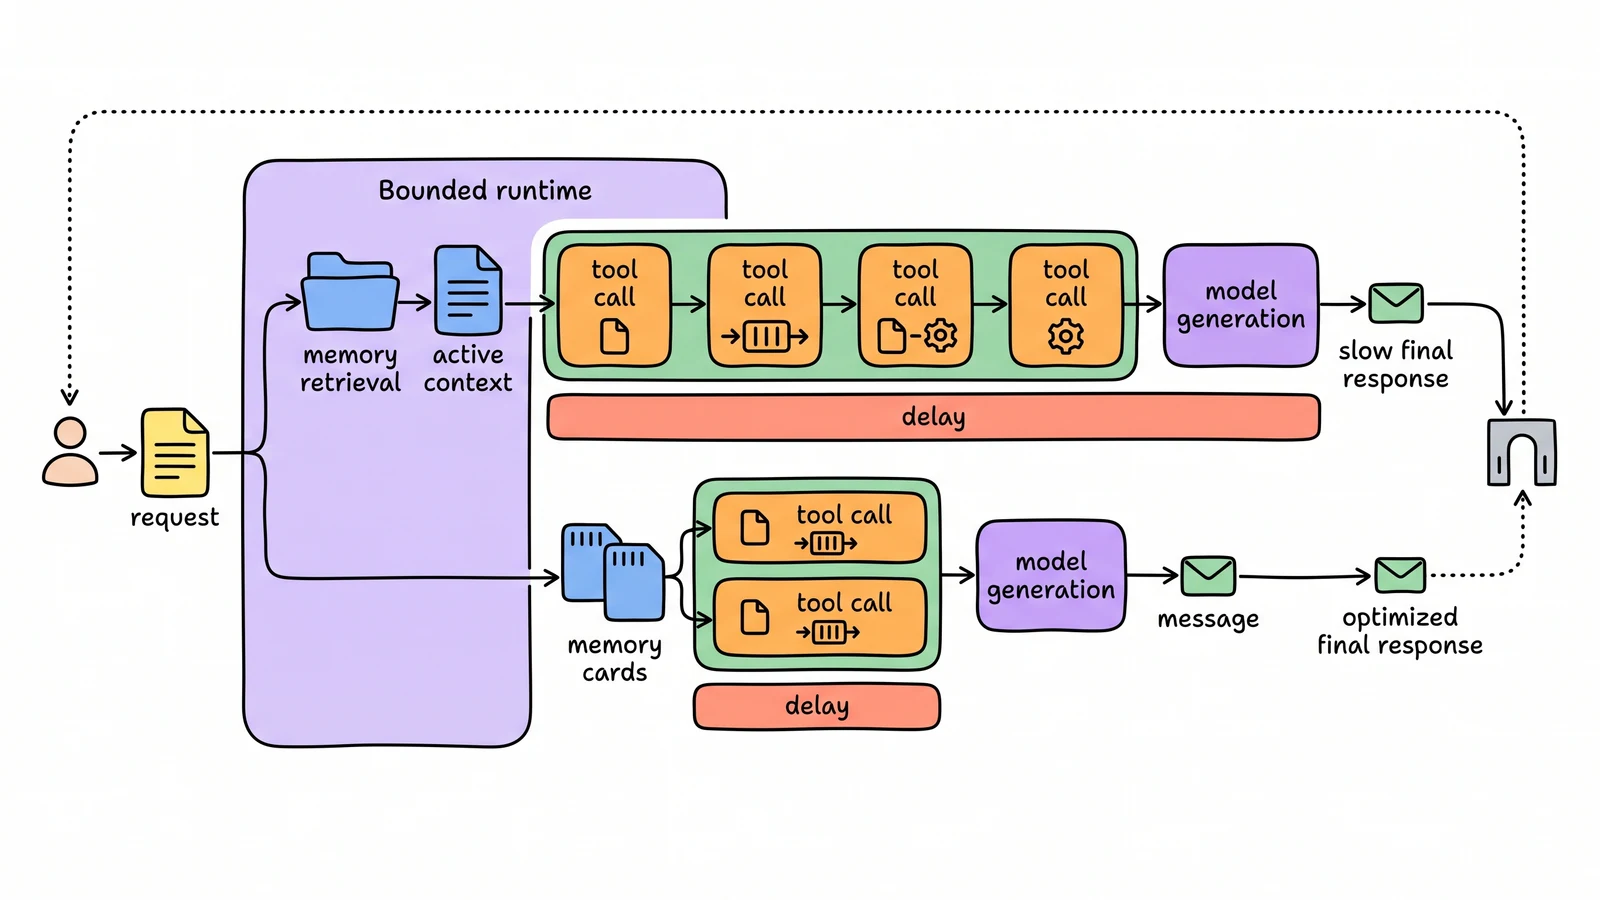
Production agents often fail without throwing errors. They still return the right answer, but every new tool, memory entry, and model turn makes them slower and more expensive until users stop trusting the workflow.
AWS frames this as two operational problems: latency without obvious breakage and unbounded memory in long-running sessions. AgentCore Observability exposes OpenTelemetry-style traces through CloudWatch so an operator can move from a slow session to the exact span that consumed the budget.
The useful starting point is an explicit performance budget for the workload. A batch agent and an interactive assistant should not share the same threshold. Once the budget exists, CloudWatch queries can isolate high-latency requests and reveal whether the delay came from memory retrieval, a slow external tool, excessive token generation, or independent calls that were serialized.
AWS’s example shows how three sequential tool calls totaling 4.5 seconds can fall to about two seconds when executed in parallel. It also recommends keeping memory retrieval under a workload-specific threshold, splitting large memory namespaces by topic, summarizing old conversation state, and imposing size limits instead of allowing every session to grow forever.
The verification step matters. After changing caching, timeouts, indexing, prompt length, memory layout, or concurrency, rerun the same trace queries and confirm that P95 latency moved inside the budget. Otherwise an optimization is only a plausible story.
This complements New Runtime’s backpressure and memory work. Admission control protects the service from too much concurrent work. Trace-level observability shows why an admitted job is still slow. Both are needed before autoscaling can be trusted.